cduck.me
1# drawSvg
2
3A Python 3 library for programmatically generating SVG images (vector drawings) and rendering them or displaying them in a Jupyter notebook.
4
5Most common SVG tags are supported and others can easily be added by writing a small subclass of `DrawableBasicElement` or `DrawableParentElement`.
6
7An interactive [Jupyter notebook](https://jupyter.org) widget, `drawSvg.widgets.DrawingWidget`, is included that can update drawings based on mouse events.
8
9# Install
10
11drawSvg is available on PyPI:
12
13```
14$ pip3 install drawSvg
15```
16
17## Prerequisites
18
19Cairo needs to be installed separately. When Cairo is installed, drawSvg can output PNG or other image formats in addition to SVG. See platform-specific [instructions for Linux, Windows, and macOS from Cairo](https://www.cairographics.org/download/). Below are some examples for installing Cairo on Linux distributions and macOS.
20
21**Ubuntu**
22
23```
24$ sudo apt-get install libcairo2
25```
26
27**macOS**
28
29Using [homebrew](https://brew.sh/):
30
31```
32$ brew install cairo
33```
34
35# Examples
36
37### Basic drawing elements
38```python
39import drawSvg as draw
40
41d = draw.Drawing(200, 100, origin='center', displayInline=False)
42
43# Draw an irregular polygon
44d.append(draw.Lines(-80, -45,
45 70, -49,
46 95, 49,
47 -90, 40,
48 close=False,
49 fill='#eeee00',
50 stroke='black'))
51
52# Draw a rectangle
53r = draw.Rectangle(-80,0,40,50, fill='#1248ff')
54r.appendTitle("Our first rectangle") # Add a tooltip
55d.append(r)
56
57# Draw a circle
58d.append(draw.Circle(-40, -10, 30,
59 fill='red', stroke_width=2, stroke='black'))
60
61# Draw an arbitrary path (a triangle in this case)
62p = draw.Path(stroke_width=2, stroke='lime',
63 fill='black', fill_opacity=0.2)
64p.M(-10, 20) # Start path at point (-10, 20)
65p.C(30, -10, 30, 50, 70, 20) # Draw a curve to (70, 20)
66d.append(p)
67
68# Draw text
69d.append(draw.Text('Basic text', 8, -10, 35, fill='blue')) # Text with font size 8
70d.append(draw.Text('Path text', 8, path=p, text_anchor='start', valign='middle'))
71d.append(draw.Text(['Multi-line', 'text'], 8, path=p, text_anchor='end'))
72
73# Draw multiple circular arcs
74d.append(draw.ArcLine(60,-20,20,60,270,
75 stroke='red', stroke_width=5, fill='red', fill_opacity=0.2))
76d.append(draw.Arc(60,-20,20,60,270,cw=False,
77 stroke='green', stroke_width=3, fill='none'))
78d.append(draw.Arc(60,-20,20,270,60,cw=True,
79 stroke='blue', stroke_width=1, fill='black', fill_opacity=0.3))
80
81# Draw arrows
82arrow = draw.Marker(-0.1, -0.5, 0.9, 0.5, scale=4, orient='auto')
83arrow.append(draw.Lines(-0.1, -0.5, -0.1, 0.5, 0.9, 0, fill='red', close=True))
84p = draw.Path(stroke='red', stroke_width=2, fill='none',
85 marker_end=arrow) # Add an arrow to the end of a path
86p.M(20, -40).L(20, -27).L(0, -20) # Chain multiple path operations
87d.append(p)
88d.append(draw.Line(30, -20, 0, -10,
89 stroke='red', stroke_width=2, fill='none',
90 marker_end=arrow)) # Add an arrow to the end of a line
91
92d.setPixelScale(2) # Set number of pixels per geometry unit
93#d.setRenderSize(400,200) # Alternative to setPixelScale
94d.saveSvg('example.svg')
95d.savePng('example.png')
96
97# Display in Jupyter notebook
98d.rasterize() # Display as PNG
99d # Display as SVG
100```
101
102[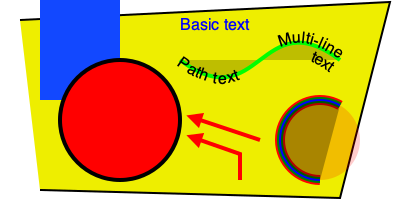](https://github.com/cduck/drawSvg/blob/master/examples/example1.svg)
103
104### Gradients
105```python
106import drawSvg as draw
107
108d = draw.Drawing(1.5, 0.8, origin='center')
109
110d.draw(draw.Rectangle(-0.75,-0.5,1.5,1, fill='#ddd'))
111
112# Create gradient
113gradient = draw.RadialGradient(0,-0.35,0.7*10)
114gradient.addStop(0.5/0.7/10, 'green', 1)
115gradient.addStop(1/10, 'red', 0)
116
117# Draw a shape to fill with the gradient
118p = draw.Path(fill=gradient, stroke='black', stroke_width=0.002)
119p.arc(0,-0.35,0.7,30,120)
120p.arc(0,-0.35,0.5,120,30,cw=True, includeL=True)
121p.Z()
122d.append(p)
123
124# Draw another shape to fill with the same gradient
125p = draw.Path(fill=gradient, stroke='red', stroke_width=0.002)
126p.arc(0,-0.35,0.75,130,160)
127p.arc(0,-0.35,0,160,130,cw=True, includeL=True)
128p.Z()
129d.append(p)
130
131# Another gradient
132gradient2 = draw.LinearGradient(0.1,-0.35,0.1+0.6,-0.35+0.2)
133gradient2.addStop(0, 'green', 1)
134gradient2.addStop(1, 'red', 0)
135d.append(draw.Rectangle(0.1,-0.35,0.6,0.2,
136 stroke='black', stroke_width=0.002,
137 fill=gradient2))
138
139# Display
140d.setRenderSize(w=600)
141d
142```
143
144[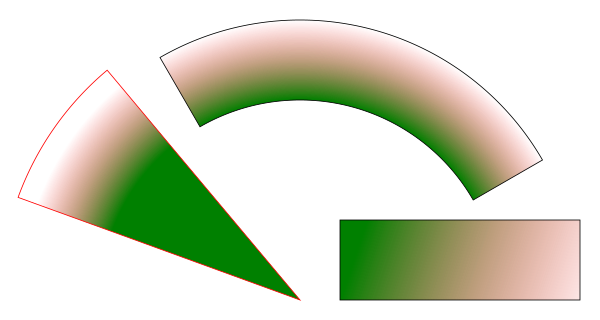](https://github.com/cduck/drawSvg/blob/master/examples/example2.svg)
145
146### Duplicate geometry and clip paths
147```python
148import drawSvg as draw
149
150d = draw.Drawing(1.4, 1.4, origin='center')
151
152# Define clip path
153clip = draw.ClipPath()
154clip.append(draw.Rectangle(-.25,.25-1,1,1))
155
156# Draw a cropped circle
157c = draw.Circle(0,0,0.5, stroke_width='0.01', stroke='black',
158 fill_opacity=0.3, clip_path=clip,
159 id='circle')
160d.append(c)
161
162# Make a transparent copy, cropped again
163g = draw.Group(opacity=0.5, clip_path=clip)
164g.append(draw.Use('circle', 0.25,0.1))
165d.append(g)
166
167# Display
168d.setRenderSize(400)
169d.rasterize()
170```
171
172[](https://github.com/cduck/drawSvg/blob/master/examples/example3.svg)
173
174### Implementing other SVG tags
175```python
176import drawSvg as draw
177
178# Subclass DrawingBasicElement if it cannot have child nodes
179# Subclass DrawingParentElement otherwise
180# Subclass DrawingDef if it must go between <def></def> tags in an SVG
181class Hyperlink(draw.DrawingParentElement):
182 TAG_NAME = 'a'
183 def __init__(self, href, target=None, **kwargs):
184 # Other init logic...
185 # Keyword arguments to super().__init__() correspond to SVG node
186 # arguments: stroke_width=5 -> stroke-width="5"
187 super().__init__(href=href, target=target, **kwargs)
188
189d = draw.Drawing(1, 1.2, origin='center')
190
191# Create hyperlink
192hlink = Hyperlink('https://www.python.org', target='_blank',
193 transform='skewY(-30)')
194# Add child elements
195hlink.append(draw.Circle(0,0,0.5, fill='green'))
196hlink.append(draw.Text('Hyperlink',0.2, 0,0, center=0.6, fill='white'))
197
198# Draw and display
199d.append(hlink)
200d.setRenderSize(200)
201d
202```
203
204[](https://github.com/cduck/drawSvg/blob/master/examples/example4.svg)
205
206### Animation with the SVG Animate Tag
207```python
208import drawSvg as draw
209
210d = draw.Drawing(200, 200, origin='center')
211
212# Animate the position and color of circle
213c = draw.Circle(0, 0, 20, fill='red')
214# See for supported attributes:
215# https://developer.mozilla.org/en-US/docs/Web/SVG/Element/animate
216c.appendAnim(draw.Animate('cy', '6s', '-80;80;-80',
217 repeatCount='indefinite'))
218c.appendAnim(draw.Animate('cx', '6s', '0;80;0;-80;0',
219 repeatCount='indefinite'))
220c.appendAnim(draw.Animate('fill', '6s', 'red;green;blue;yellow',
221 calcMode='discrete',
222 repeatCount='indefinite'))
223d.append(c)
224
225# Animate a black circle around an ellipse
226ellipse = draw.Path()
227ellipse.M(-90, 0)
228ellipse.A(90, 40, 360, True, True, 90, 0) # Ellipse path
229ellipse.A(90, 40, 360, True, True, -90, 0)
230ellipse.Z()
231c2 = draw.Circle(0, 0, 10)
232# See for supported attributes:
233# https://developer.mozilla.org/en-US/docs/Web/SVG/Element/animateMotion
234c2.appendAnim(draw.AnimateMotion(ellipse, '3s',
235 repeatCount='indefinite'))
236# See for supported attributes:
237# https://developer.mozilla.org/en-US/docs/Web/SVG/Element/animateTransform
238c2.appendAnim(draw.AnimateTransform('scale', '3s', '1,2;2,1;1,2;2,1;1,2',
239 repeatCount='indefinite'))
240d.append(c2)
241
242d.saveSvg('animated.svg') # Save to file
243d # Display in Jupyter notebook
244```
245
246[](https://github.com/cduck/drawSvg/blob/master/examples/animated.svg)
247
248### Interactive Widget
249```python
250import drawSvg as draw
251from drawSvg.widgets import DrawingWidget
252import hyperbolic.poincare.shapes as hyper # pip3 install hyperbolic
253
254# Create drawing
255d = draw.Drawing(2, 2, origin='center')
256d.setRenderSize(500)
257d.append(draw.Circle(0, 0, 1, fill='orange'))
258group = draw.Group()
259d.append(group)
260
261# Update the drawing based on user input
262click_list = []
263def redraw(points):
264 group.children.clear()
265 for x1, y1 in points:
266 for x2, y2 in points:
267 if (x1, y1) == (x2, y2): continue
268 p1 = hyper.Point.fromEuclid(x1, y1)
269 p2 = hyper.Point.fromEuclid(x2, y2)
270 if p1.distanceTo(p2) <= 2:
271 line = hyper.Line.fromPoints(*p1, *p2, segment=True)
272 group.draw(line, hwidth=0.2, fill='white')
273 for x, y in points:
274 p = hyper.Point.fromEuclid(x, y)
275 group.draw(hyper.Circle.fromCenterRadius(p, 0.1),
276 fill='green')
277redraw(click_list)
278
279# Create interactive widget and register mouse events
280widget = DrawingWidget(d)
281@widget.mousedown
282def mousedown(widget, x, y, info):
283 if (x**2 + y**2) ** 0.5 + 1e-5 < 1:
284 click_list.append((x, y))
285 redraw(click_list)
286 widget.refresh()
287@widget.mousemove
288def mousemove(widget, x, y, info):
289 if (x**2 + y**2) ** 0.5 + 1e-5 < 1:
290 redraw(click_list + [(x, y)])
291 widget.refresh()
292widget
293```
294
295
296
297### Animation with Python
298```python
299import drawSvg as draw
300
301# Draw a frame of the animation
302def draw_frame(t):
303 d = draw.Drawing(2, 6.05, origin=(-1,-1.05))
304 d.setRenderSize(h=300)
305 d.append(draw.Rectangle(-2, -2, 4, 8, fill='white'))
306 d.append(draw.Rectangle(-1, -1.05, 2, 0.05, fill='brown'))
307 t = (t + 1) % 2 - 1
308 y = 4 - t**2 * 4
309 d.append(draw.Circle(0, y, 1, fill='lime'))
310 return d
311
312with draw.animate_jupyter(draw_frame, delay=0.05) as anim:
313# Or:
314#with draw.animate_video('example6.gif', draw_frame, duration=0.05
315# ) as anim:
316 # Add each frame to the animation
317 for i in range(20):
318 anim.draw_frame(i/10)
319 for i in range(20):
320 anim.draw_frame(i/10)
321 for i in range(20):
322 anim.draw_frame(i/10)
323```
324
325
326
327### Asynchronous Animation in Jupyter
328```python
329# Jupyter cell 1:
330import drawSvg as draw
331from drawSvg.widgets import AsyncAnimation
332widget = AsyncAnimation(fps=10)
333widget
334# [Animation is displayed here (click to pause)]
335
336# Jupyter cell 2:
337global_variable = 'a'
338@widget.set_draw_frame # Animation above is automatically updated
339def draw_frame(secs=0):
340 # Draw something...
341 d = draw.Drawing(100, 40)
342 d.append(draw.Text(global_variable, 20, 0, 10))
343 d.append(draw.Text('{:0.1f}'.format(secs), 20, 30, 10))
344 return d
345
346# Jupyter cell 3:
347global_variable = 'b' # Animation above now displays 'b'
348```
349
350