 cduck.me
1[](https://github.com/cduck/drawSvg/blob/v2/examples/logo.ipynb)
2
3A Python 3 library for programmatically generating SVG images and animations that can render and display your drawings in a Jupyter notebook or Jupyter lab.
4
5Most common SVG tags are supported and others can easily be added by writing a small subclass of `DrawableBasicElement` or `DrawableParentElement`. [Nearly all SVG attributes](https://developer.mozilla.org/en-US/docs/Web/SVG) are supported via keyword args (e.g. Python keyword argument `fill_opacity=0.5` becomes SVG attribute `fill-opacity="0.5"`).
6
7An interactive [Jupyter notebook](https://jupyter.org) widget, `drawsvg.widgets.DrawingWidget`, [is included](#interactive-widget) that can update drawings based on mouse events. The widget does not yet work in Jupyter lab.
8
9# Install
10
11~drawsvg is available on PyPI:~ Install the pre-release of drawsvg 2.0:
12
13```bash
14$ python3 -m pip install -e "git+https://github.com/cduck/drawsvg.git@v2#egg=drawsvg[all]"
15```
16~`$ pip3 install "drawsvg[all]"`~
17
18## Prerequisites (optional)
19
20Cairo needs to be installed separately. When Cairo is installed, drawsvg can output PNG or other image formats in addition to SVG. See platform-specific [instructions for Linux, Windows, and macOS from Cairo](https://www.cairographics.org/download/). Below are some examples for installing Cairo on Linux distributions and macOS.
21
22**Ubuntu**
23
24```bash
25$ sudo apt-get install libcairo2
26```
27
28**macOS**
29
30Using [homebrew](https://brew.sh/):
31
32```bash
33$ brew install cairo
34```
35
36# Examples
37
38### Basic drawing elements
39```python
40import drawsvg as draw
41
42d = draw.Drawing(200, 100, origin='center')
43
44# Draw an irregular polygon
45d.append(draw.Lines(-80, 45,
46 70, 49,
47 95, -49,
48 -90, -40,
49 close=False,
50 fill='#eeee00',
51 stroke='black'))
52
53# Draw a rectangle
54r = draw.Rectangle(-80, -50, 40, 50, fill='#1248ff')
55r.append_title("Our first rectangle") # Add a tooltip
56d.append(r)
57
58# Draw a circle
59d.append(draw.Circle(-40, 10, 30,
60 fill='red', stroke_width=2, stroke='black'))
61
62# Draw an arbitrary path (a triangle in this case)
63p = draw.Path(stroke_width=2, stroke='lime', fill='black', fill_opacity=0.2)
64p.M(-10, -20) # Start path at point (-10, -20)
65p.C(30, 10, 30, -50, 70, -20) # Draw a curve to (70, -20)
66d.append(p)
67
68# Draw text
69d.append(draw.Text('Basic text', 8, -10, -35, fill='blue')) # 8pt text at (-10, -35)
70d.append(draw.Text('Path text', 8, path=p, text_anchor='start', line_height=1))
71d.append(draw.Text(['Multi-line', 'text'], 8, path=p, text_anchor='end', center=True))
72
73# Draw multiple circular arcs
74d.append(draw.ArcLine(60, 20, 20, 60, 270,
75 stroke='red', stroke_width=5, fill='red', fill_opacity=0.2))
76d.append(draw.Arc(60, 20, 20, 90, -60, cw=True,
77 stroke='green', stroke_width=3, fill='none'))
78d.append(draw.Arc(60, 20, 20, -60, 90, cw=False,
79 stroke='blue', stroke_width=1, fill='black', fill_opacity=0.3))
80
81# Draw arrows
82arrow = draw.Marker(-0.1, -0.51, 0.9, 0.5, scale=4, orient='auto')
83arrow.append(draw.Lines(-0.1, 0.5, -0.1, -0.5, 0.9, 0, fill='red', close=True))
84p = draw.Path(stroke='red', stroke_width=2, fill='none',
85 marker_end=arrow) # Add an arrow to the end of a path
86p.M(20, 40).L(20, 27).L(0, 20) # Chain multiple path commands
87d.append(p)
88d.append(draw.Line(30, 20, 0, 10,
89 stroke='red', stroke_width=2, fill='none',
90 marker_end=arrow)) # Add an arrow to the end of a line
91
92d.set_pixel_scale(2) # Set number of pixels per geometry unit
93#d.set_render_size(400, 200) # Alternative to set_pixel_scale
94d.save_svg('example.svg')
95d.save_png('example.png')
96
97# Display in Jupyter notebook
98d.rasterize() # Display as PNG
99d # Display as SVG
100```
101
102[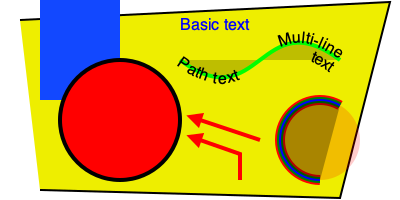](https://github.com/cduck/drawsvg/blob/master/examples/example1.svg)
103
104### SVG-native animation with playback controls
105```python
106import drawsvg as draw
107
108d = draw.Drawing(400, 200, origin='center',
109 animation_config=draw.types.SyncedAnimationConfig(
110 # Animation configuration
111 duration=8, # Seconds
112 show_playback_progress=True,
113 show_playback_controls=True,
114 )
115)
116d.append(draw.Rectangle(-200, -100, 400, 200, fill='#eee')) # Background
117d.append(draw.Circle(0, 0, 40, fill='green')) # Center circle
118circle = draw.Circle(0, 0, 0, fill='silver', stroke='gray') # Moving circle
119# Animation
120circle.add_key_frame(0, cx=-100, cy=0, r=0, stroke_width=0)
121circle.add_key_frame(2, cx=0, cy=-100, r=40, stroke_width=5)
122circle.add_key_frame(4, cx=100, cy=0, r=0, stroke_width=0)
123circle.add_key_frame(6, cx=0, cy=100, r=40, stroke_width=5)
124circle.add_key_frame(8, cx=-100, cy=0, r=0, stroke_width=0)
125d.append(circle)
126
127# Changing text
128draw.native_animation.animate_text_sequence(
129 d,
130 [0, 2, 4, 6],
131 ['0', '1', '2', '3'],
132 30, 0, 1, fill='yellow', center=True)
133
134# Save as a standalone animated SVG or HTML
135d.save_svg('playback-controls.svg')
136d.save_html('playback-controls.html')
137
138# Display in Jupyter notebook
139#d.display_image() # Display SVG as an image (will not be interactive)
140#d.display_iframe() # Display as interactive SVG (alternative)
141d.display_inline() # Display as interactive SVG
142```
143
144[](https://github.com/cduck/drawsvg/blob/master/examples/playback-controls.svg)
145
146Note: GitHub blocks the playback controls.
147Download the above SVG and open it in a web browser to try.
148
149### Gradients
150```python
151import drawsvg as draw
152
153d = draw.Drawing(1.5, 0.8, origin='center')
154
155d.draw(draw.Rectangle(-0.75, -0.5, 1.5, 1, fill='#ddd'))
156
157# Create gradient
158gradient = draw.RadialGradient(0, 0.35, 0.7*10)
159gradient.add_stop(0.5/0.7/10, 'green', 1)
160gradient.add_stop(1/10, 'red', 0)
161
162# Draw a shape to fill with the gradient
163p = draw.Path(fill=gradient, stroke='black', stroke_width=0.002)
164p.arc(0, 0.35, 0.7, -30, -120, cw=False)
165p.arc(0, 0.35, 0.5, -120, -30, cw=True, include_l=True)
166p.Z()
167d.append(p)
168
169# Draw another shape to fill with the same gradient
170p = draw.Path(fill=gradient, stroke='red', stroke_width=0.002)
171p.arc(0, 0.35, 0.75, -130, -160, cw=False)
172p.arc(0, 0.35, 0, -160, -130, cw=True, include_l=True)
173p.Z()
174d.append(p)
175
176# Another gradient
177gradient2 = draw.LinearGradient(0.1, 0.35, 0.1+0.6, 0.35+0.2)
178gradient2.add_stop(0, 'green', 1)
179gradient2.add_stop(1, 'red', 0)
180d.append(draw.Rectangle(0.1, 0.15, 0.6, 0.2,
181 stroke='black', stroke_width=0.002,
182 fill=gradient2))
183
184# Display
185d.set_render_size(w=600)
186d
187```
188
189[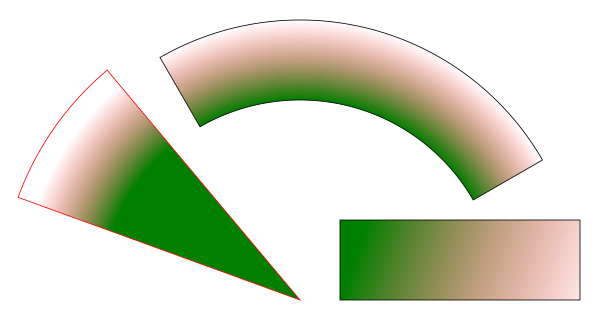](https://github.com/cduck/drawsvg/blob/master/examples/example2.svg)
190
191### Duplicate geometry, clip paths
192```python
193import drawsvg as draw
194
195d = draw.Drawing(1.4, 1.4, origin='center')
196
197# Define clip path
198clip = draw.ClipPath()
199clip.append(draw.Rectangle(-.25, -.25, 1, 1))
200
201# Draw a cropped circle
202circle = draw.Circle(0, 0, 0.5,
203 stroke_width='0.01', stroke='black',
204 fill_opacity=0.3, clip_path=clip)
205d.append(circle)
206
207# Make a transparent copy, cropped again
208g = draw.Group(opacity=0.5, clip_path=clip)
209# Here, circle is not directly appended to the drawing.
210# drawsvg recognizes that `Use` references `circle` and automatically adds
211# `circle` to the <defs></defs> section of the SVG.
212g.append(draw.Use(circle, 0.25, -0.1))
213d.append(g)
214
215# Display
216d.set_render_size(400)
217d.rasterize()
218```
219
220[](https://github.com/cduck/drawsvg/blob/master/examples/example3.svg)
221
222### Organizing and duplicating drawing elements
223```python
224import drawsvg as draw
225
226d = draw.Drawing(300, 100)
227d.set_pixel_scale(2)
228
229# Use groups to contain other elements
230# Children elements of groups inherit the coordinate system (transform)
231# and attribute values
232group = draw.Group(fill='orange', transform='rotate(-20)')
233group.append(draw.Rectangle(0, 10, 20, 40)) # This rectangle will be orange
234group.append(draw.Circle(30, 40, 10)) # This circle will also be orange
235group.append(draw.Circle(50, 40, 10, fill='green')) # This circle will not
236d.append(group)
237
238# Use the Use element to make duplicates of elements
239# Each duplicate can be placed at an offset (x, y) location and any additional
240# attributes (like fill color) are inherited if the element didn't specify them.
241d.append(draw.Use(group, 80, 0, stroke='black', stroke_width=1))
242d.append(draw.Use(group, 80, 20, stroke='blue', stroke_width=2))
243d.append(draw.Use(group, 80, 40, stroke='red', stroke_width=3))
244
245d.display_inline()
246```
247
248[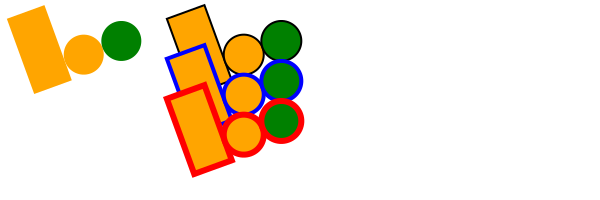](https://github.com/cduck/drawsvg/blob/master/examples/example8.svg)
249
250### Implementing other SVG tags
251```python
252import drawsvg as draw
253
254# Subclass DrawingBasicElement if it cannot have child nodes
255# Subclass DrawingParentElement otherwise
256# Subclass DrawingDef if it must go between <def></def> tags in an SVG
257class Hyperlink(draw.DrawingParentElement):
258 TAG_NAME = 'a'
259 def __init__(self, href, target=None, **kwargs):
260 # Other init logic...
261 # Keyword arguments to super().__init__() correspond to SVG node
262 # arguments: stroke_width=5 -> <a stroke-width="5" ...>...</a>
263 super().__init__(href=href, target=target, **kwargs)
264
265d = draw.Drawing(1, 1.2, origin='center')
266
267# Create hyperlink
268hlink = Hyperlink('https://www.python.org', target='_blank',
269 transform='skewY(-30)')
270# Add child elements
271hlink.append(draw.Circle(0, 0, 0.5, fill='green'))
272hlink.append(draw.Text('Hyperlink', 0.2, 0, 0, center=0.6, fill='white'))
273
274# Draw and display
275d.append(hlink)
276d.set_render_size(200)
277d
278```
279
280[](https://github.com/cduck/drawsvg/blob/master/examples/example4.svg)
281
282### Animation with the SVG Animate Tag
283```python
284import drawsvg as draw
285
286d = draw.Drawing(200, 200, origin='center')
287
288# Animate the position and color of circle
289c = draw.Circle(0, 0, 20, fill='red')
290# See for supported attributes:
291# https://developer.mozilla.org/en-US/docs/Web/SVG/Element/animate
292c.append_anim(draw.Animate('cy', '6s', '-80;80;-80',
293 repeatCount='indefinite'))
294c.append_anim(draw.Animate('cx', '6s', '0;80;0;-80;0',
295 repeatCount='indefinite'))
296c.append_anim(draw.Animate('fill', '6s', 'red;green;blue;yellow',
297 calc_mode='discrete',
298 repeatCount='indefinite'))
299d.append(c)
300
301# Animate a black circle around an ellipse
302ellipse = draw.Path()
303ellipse.M(-90, 0)
304ellipse.A(90, 40, 360, True, True, 90, 0) # Ellipse path
305ellipse.A(90, 40, 360, True, True, -90, 0)
306ellipse.Z()
307c2 = draw.Circle(0, 0, 10)
308# See for supported attributes:
309# https://developer.mozilla.org/en-US/docs/Web/SVG/Element/animate_motion
310c2.append_anim(draw.AnimateMotion(ellipse, '3s',
311 repeatCount='indefinite'))
312# See for supported attributes:
313# https://developer.mozilla.org/en-US/docs/Web/SVG/Element/animate_transform
314c2.append_anim(draw.AnimateTransform('scale', '3s', '1,2;2,1;1,2;2,1;1,2',
315 repeatCount='indefinite'))
316d.append(c2)
317
318d.save_svg('animated.svg') # Save to file
319d # Display in Jupyter notebook
320```
321
322[](https://github.com/cduck/drawsvg/blob/master/examples/animated.svg)
323
324### Interactive Widget
325```python
326import drawsvg as draw
327from drawsvg.widgets import DrawingWidget
328import hyperbolic.poincare.shapes as hyper # pip3 install hyperbolic
329from hyperbolic import euclid
330
331# Patch the hyperbolic package for drawsvg version 2
332patch = lambda m: lambda self, **kw: m(self, draw, **kw)
333hyper.Circle.to_drawables = patch(hyper.Circle.toDrawables)
334hyper.Line.to_drawables = patch(hyper.Line.toDrawables)
335euclid.Arc.Arc.drawToPath = lambda self, path, includeM=True, includeL=False: path.arc(self.cx, self.cy, self.r, self.startDeg, self.endDeg, cw=not self.cw, include_m=includeM, include_l=includeL)
336
337# Create drawing
338d = draw.Drawing(2, 2, origin='center', context=draw.Context(invert_y=True))
339d.set_render_size(500)
340d.append(draw.Circle(0, 0, 1, fill='orange'))
341group = draw.Group()
342d.append(group)
343
344# Update the drawing based on user input
345click_list = []
346def redraw(points):
347 group.children.clear()
348 for x1, y1 in points:
349 for x2, y2 in points:
350 if (x1, y1) == (x2, y2): continue
351 p1 = hyper.Point.fromEuclid(x1, y1)
352 p2 = hyper.Point.fromEuclid(x2, y2)
353 if p1.distanceTo(p2) <= 2:
354 line = hyper.Line.fromPoints(*p1, *p2, segment=True)
355 group.draw(line, hwidth=0.2, fill='white')
356 for x, y in points:
357 p = hyper.Point.fromEuclid(x, y)
358 group.draw(hyper.Circle.fromCenterRadius(p, 0.1),
359 fill='green')
360redraw(click_list)
361
362# Create interactive widget and register mouse events
363widget = DrawingWidget(d)
364@widget.mousedown
365def mousedown(widget, x, y, info):
366 if (x**2 + y**2) ** 0.5 + 1e-5 < 1:
367 click_list.append((x, y))
368 redraw(click_list)
369 widget.refresh()
370@widget.mousemove
371def mousemove(widget, x, y, info):
372 if (x**2 + y**2) ** 0.5 + 1e-5 < 1:
373 redraw(click_list + [(x, y)])
374 widget.refresh()
375widget
376```
377
378
379
380Note: The above example currently only works in `jupyter notebook`, not `jupyter lab`.
381
382### Frame-by-Frame Animation
383```python
384import drawsvg as draw
385
386# Draw a frame of the animation
387def draw_frame(t):
388 d = draw.Drawing(2, 6.05, origin=(-1, -5))
389 d.set_render_size(h=300)
390 d.append(draw.Rectangle(-2, -6, 4, 8, fill='white'))
391 d.append(draw.Rectangle(-1, 1, 2, 0.05, fill='brown'))
392 t = (t + 1) % 2 - 1
393 y = t**2 * 4 - 4
394 d.append(draw.Circle(0, y, 1, fill='lime'))
395 return d
396
397with draw.frame_animate_jupyter(draw_frame, delay=0.05) as anim:
398# Or:
399#with draw.animate_video('example6.gif', draw_frame, duration=0.05
400# ) as anim:
401 # Add each frame to the animation
402 for i in range(20):
403 anim.draw_frame(i/10)
404 for i in range(20):
405 anim.draw_frame(i/10)
406 for i in range(20):
407 anim.draw_frame(i/10)
408```
409
410
411
412### Asynchronous Frame-based Animation in Jupyter
413```python
414# Jupyter cell 1:
415import drawsvg as draw
416from drawsvg.widgets import AsyncAnimation
417widget = AsyncAnimation(fps=10)
418widget
419# [Animation is displayed here (click to pause)]
420
421# Jupyter cell 2:
422global_variable = 'a'
423@widget.set_draw_frame # Animation above is automatically updated
424def draw_frame(secs=0):
425 # Draw something...
426 d = draw.Drawing(100, 40)
427 d.append(draw.Text(global_variable, 20, 0, 30))
428 d.append(draw.Text('{:0.1f}'.format(secs), 20, 30, 30))
429 return d
430
431# Jupyter cell 3:
432global_variable = 'b' # Animation above now displays 'b'
433```
434
435
436
437Note: The above example currently only works in `jupyter notebook`, not `jupyter lab`.