 cduck.me
1[](https://github.com/cduck/drawSvg/blob/master/examples/logo.svg)
2
3A Python 3 library for programmatically generating SVG images and animations that can render and display your drawings in a Jupyter notebook or Jupyter lab.
4
5Most common SVG tags are supported and others can easily be added by writing a small subclass of `DrawableBasicElement` or `DrawableParentElement`. [Nearly all SVG attributes](https://developer.mozilla.org/en-US/docs/Web/SVG) are supported via keyword args (e.g. Python keyword argument `fill_opacity=0.5` becomes SVG attribute `fill-opacity="0.5"`).
6
7An interactive [Jupyter notebook](https://jupyter.org) widget, `drawsvg.widgets.DrawingWidget`, [is included](#interactive-widget) that can update drawings based on mouse events. The widget does not yet work in Jupyter lab.
8
9[SVG quick reference docs](https://cduck.github.io/drawsvg/)
10
11
12# Install
13
14Drawsvg is available on PyPI:
15```bash
16$ python3 -m pip install "drawsvg~=2.0"
17```
18
19To enable raster image support (PNG, MP4, and GIF), follow the [full-feature install instructions](#full-feature-install).
20
21
22## Upgrading from version 1.x
23
24Major breaking changes:
25
26- camelCase method and argument names are now snake\_case and the package name is lowercase (except for arguments that correspond to camelCase SVG attributes).
27- The default coordinate system y-axis now matches the SVG coordinate system (y increases down the screen, x increases right)
28- How to fix `ModuleNotFoundError: No module named 'drawSvg'` (with a capital S)? Either pip install `"drawSvg~=1.9"` or update your code for drawsvg 2.x (for example, change `drawSvg` to `drawsvg` and `d.saveSvg` to `d.save_svg`).
29
30
31# Examples
32
33### Basic drawing elements
34```python
35import drawsvg as draw
36
37d = draw.Drawing(200, 100, origin='center')
38
39# Draw an irregular polygon
40d.append(draw.Lines(-80, 45,
41 70, 49,
42 95, -49,
43 -90, -40,
44 close=False,
45 fill='#eeee00',
46 stroke='black'))
47
48# Draw a rectangle
49r = draw.Rectangle(-80, -50, 40, 50, fill='#1248ff')
50r.append_title("Our first rectangle") # Add a tooltip
51d.append(r)
52
53# Draw a circle
54d.append(draw.Circle(-40, 10, 30,
55 fill='red', stroke_width=2, stroke='black'))
56
57# Draw an arbitrary path (a triangle in this case)
58p = draw.Path(stroke_width=2, stroke='lime', fill='black', fill_opacity=0.2)
59p.M(-10, -20) # Start path at point (-10, -20)
60p.C(30, 10, 30, -50, 70, -20) # Draw a curve to (70, -20)
61d.append(p)
62
63# Draw text
64d.append(draw.Text('Basic text', 8, -10, -35, fill='blue')) # 8pt text at (-10, -35)
65d.append(draw.Text('Path text', 8, path=p, text_anchor='start', line_height=1))
66d.append(draw.Text(['Multi-line', 'text'], 8, path=p, text_anchor='end', center=True))
67
68# Draw multiple circular arcs
69d.append(draw.ArcLine(60, 20, 20, 60, 270,
70 stroke='red', stroke_width=5, fill='red', fill_opacity=0.2))
71d.append(draw.Arc(60, 20, 20, 90, -60, cw=True,
72 stroke='green', stroke_width=3, fill='none'))
73d.append(draw.Arc(60, 20, 20, -60, 90, cw=False,
74 stroke='blue', stroke_width=1, fill='black', fill_opacity=0.3))
75
76# Draw arrows
77arrow = draw.Marker(-0.1, -0.51, 0.9, 0.5, scale=4, orient='auto')
78arrow.append(draw.Lines(-0.1, 0.5, -0.1, -0.5, 0.9, 0, fill='red', close=True))
79p = draw.Path(stroke='red', stroke_width=2, fill='none',
80 marker_end=arrow) # Add an arrow to the end of a path
81p.M(20, 40).L(20, 27).L(0, 20) # Chain multiple path commands
82d.append(p)
83d.append(draw.Line(30, 20, 0, 10,
84 stroke='red', stroke_width=2, fill='none',
85 marker_end=arrow)) # Add an arrow to the end of a line
86
87d.set_pixel_scale(2) # Set number of pixels per geometry unit
88#d.set_render_size(400, 200) # Alternative to set_pixel_scale
89d.save_svg('example.svg')
90d.save_png('example.png')
91
92# Display in Jupyter notebook
93#d.rasterize() # Display as PNG
94d # Display as SVG
95```
96
97[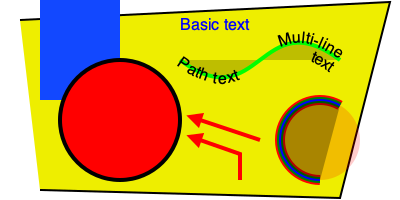](https://github.com/cduck/drawsvg/blob/master/examples/example1.svg)
98
99### SVG-native animation with playback controls
100```python
101import drawsvg as draw
102
103d = draw.Drawing(400, 200, origin='center',
104 animation_config=draw.types.SyncedAnimationConfig(
105 # Animation configuration
106 duration=8, # Seconds
107 show_playback_progress=True,
108 show_playback_controls=True))
109d.append(draw.Rectangle(-200, -100, 400, 200, fill='#eee')) # Background
110d.append(draw.Circle(0, 0, 40, fill='green')) # Center circle
111
112# Animation
113circle = draw.Circle(0, 0, 0, fill='gray') # Moving circle
114circle.add_key_frame(0, cx=-100, cy=0, r=0)
115circle.add_key_frame(2, cx=0, cy=-100, r=40)
116circle.add_key_frame(4, cx=100, cy=0, r=0)
117circle.add_key_frame(6, cx=0, cy=100, r=40)
118circle.add_key_frame(8, cx=-100, cy=0, r=0)
119d.append(circle)
120r = draw.Rectangle(0, 0, 0, 0, fill='silver') # Moving square
121r.add_key_frame(0, x=-100, y=0, width=0, height=0)
122r.add_key_frame(2, x=0-20, y=-100-20, width=40, height=40)
123r.add_key_frame(4, x=100, y=0, width=0, height=0)
124r.add_key_frame(6, x=0-20, y=100-20, width=40, height=40)
125r.add_key_frame(8, x=-100, y=0, width=0, height=0)
126d.append(r)
127
128# Changing text
129draw.native_animation.animate_text_sequence(
130 d,
131 [0, 2, 4, 6],
132 ['0', '1', '2', '3'],
133 30, 0, 1, fill='yellow', center=True)
134
135# Save as a standalone animated SVG or HTML
136d.save_svg('playback-controls.svg')
137d.save_html('playback-controls.html')
138
139# Display in Jupyter notebook
140#d.display_image() # Display SVG as an image (will not be interactive)
141#d.display_iframe() # Display as interactive SVG (alternative)
142#d.as_gif('orbit.gif', fps=10) # Render as a GIF image, optionally save to file
143#d.as_mp4('orbig.mp4', fps=60, verbose=True) # Render as an MP4 video, optionally save to file
144#d.as_spritesheet('orbit-spritesheet.png', row_length=10, fps=3) # Render as a spritesheet
145d.display_inline() # Display as interactive SVG
146```
147
148[](https://github.com/cduck/drawsvg/blob/master/examples/playback-controls.svg)
149
150Note: GitHub blocks the playback controls.
151Download the above SVG and open it in a web browser to try.
152
153https://user-images.githubusercontent.com/2476062/221400434-1529d237-e9bf-4363-a143-0ece75cd349a.mp4
154
155### Patterns and gradients
156```python
157import drawsvg as draw
158
159d = draw.Drawing(1.5, 0.8, origin='center')
160
161# Background pattern (not supported by Cairo, d.rasterize() will not show it)
162pattern = draw.Pattern(width=0.13, height=0.23)
163pattern.append(draw.Rectangle(0, 0, .1, .1, fill='yellow'))
164pattern.append(draw.Rectangle(0, .1, .1, .1, fill='orange'))
165d.draw(draw.Rectangle(-0.75, -0.5, 1.5, 1, fill=pattern, fill_opacity=0.4))
166
167# Create gradient
168gradient = draw.RadialGradient(0, 0.35, 0.7*10)
169gradient.add_stop(0.5/0.7/10, 'green', 1)
170gradient.add_stop(1/10, 'red', 0)
171
172# Draw a shape to fill with the gradient
173p = draw.Path(fill=gradient, stroke='black', stroke_width=0.002)
174p.arc(0, 0.35, 0.7, -30, -120, cw=False)
175p.arc(0, 0.35, 0.5, -120, -30, cw=True, include_l=True)
176p.Z()
177d.append(p)
178
179# Draw another shape to fill with the same gradient
180p = draw.Path(fill=gradient, stroke='red', stroke_width=0.002)
181p.arc(0, 0.35, 0.75, -130, -160, cw=False)
182p.arc(0, 0.35, 0, -160, -130, cw=True, include_l=True)
183p.Z()
184d.append(p)
185
186# Another gradient
187gradient2 = draw.LinearGradient(0.1, 0.35, 0.1+0.6, 0.35+0.2)
188gradient2.add_stop(0, 'green', 1)
189gradient2.add_stop(1, 'red', 0)
190d.append(draw.Rectangle(0.1, 0.15, 0.6, 0.2,
191 stroke='black', stroke_width=0.002,
192 fill=gradient2))
193
194# Display
195d.set_render_size(w=600)
196d
197```
198
199[](https://github.com/cduck/drawsvg/blob/master/examples/example2.svg)
200
201### Duplicate geometry and clip paths
202```python
203import drawsvg as draw
204
205d = draw.Drawing(1.4, 1.4, origin='center')
206
207# Define clip path
208clip = draw.ClipPath()
209clip.append(draw.Rectangle(-.25, -.25, 1, 1))
210
211# Draw a cropped circle
212circle = draw.Circle(0, 0, 0.5,
213 stroke_width='0.01', stroke='black',
214 fill_opacity=0.3, clip_path=clip)
215d.append(circle)
216
217# Make a transparent copy, cropped again
218g = draw.Group(opacity=0.5, clip_path=clip)
219# Here, circle is not directly appended to the drawing.
220# drawsvg recognizes that `Use` references `circle` and automatically adds
221# `circle` to the <defs></defs> section of the SVG.
222g.append(draw.Use(circle, 0.25, -0.1))
223d.append(g)
224
225# Display
226d.set_render_size(400)
227#d.rasterize() # Display as PNG
228d # Display as SVG
229```
230
231[](https://github.com/cduck/drawsvg/blob/master/examples/example3.svg)
232
233### Organizing and duplicating drawing elements
234```python
235import drawsvg as draw
236
237d = draw.Drawing(300, 100)
238d.set_pixel_scale(2)
239
240# Use groups to contain other elements
241# Children elements of groups inherit the coordinate system (transform)
242# and attribute values
243group = draw.Group(fill='orange', transform='rotate(-20)')
244group.append(draw.Rectangle(0, 10, 20, 40)) # This rectangle will be orange
245group.append(draw.Circle(30, 40, 10)) # This circle will also be orange
246group.append(draw.Circle(50, 40, 10, fill='green')) # This circle will not
247d.append(group)
248
249# Use the Use element to make duplicates of elements
250# Each duplicate can be placed at an offset (x, y) location and any additional
251# attributes (like fill color) are inherited if the element didn't specify them.
252d.append(draw.Use(group, 80, 0, stroke='black', stroke_width=1))
253d.append(draw.Use(group, 80, 20, stroke='blue', stroke_width=2))
254d.append(draw.Use(group, 80, 40, stroke='red', stroke_width=3))
255
256d.display_inline()
257```
258
259[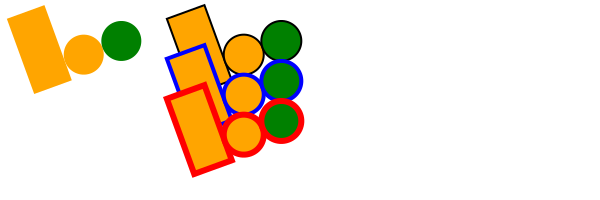](https://github.com/cduck/drawsvg/blob/master/examples/example8.svg)
260
261### Implementing other SVG tags
262```python
263import drawsvg as draw
264
265# Subclass DrawingBasicElement if it cannot have child nodes
266# Subclass DrawingParentElement otherwise
267# Subclass DrawingDef if it must go between <def></def> tags in an SVG
268class Hyperlink(draw.DrawingParentElement):
269 TAG_NAME = 'a'
270 def __init__(self, href, target=None, **kwargs):
271 # Other init logic...
272 # Keyword arguments to super().__init__() correspond to SVG node
273 # arguments: stroke_width=5 -> <a stroke-width="5" ...>...</a>
274 super().__init__(href=href, target=target, **kwargs)
275
276d = draw.Drawing(1, 1.2, origin='center')
277
278# Create hyperlink
279hlink = Hyperlink('https://www.python.org', target='_blank',
280 transform='skewY(-30)')
281# Add child elements
282hlink.append(draw.Circle(0, 0, 0.5, fill='green'))
283hlink.append(draw.Text('Hyperlink', 0.2, 0, 0, center=0.6, fill='white'))
284
285# Draw and display
286d.append(hlink)
287d.set_render_size(200)
288d
289```
290
291[](https://github.com/cduck/drawsvg/blob/master/examples/example4.svg)
292
293### Animation with the SVG Animate Tag
294```python
295import drawsvg as draw
296
297d = draw.Drawing(200, 200, origin='center')
298
299# Animate the position and color of circle
300c = draw.Circle(0, 0, 20, fill='red')
301# See for supported attributes:
302# https://developer.mozilla.org/en-US/docs/Web/SVG/Element/animate
303c.append_anim(draw.Animate('cy', '6s', '-80;80;-80',
304 repeatCount='indefinite'))
305c.append_anim(draw.Animate('cx', '6s', '0;80;0;-80;0',
306 repeatCount='indefinite'))
307c.append_anim(draw.Animate('fill', '6s', 'red;green;blue;yellow',
308 calc_mode='discrete',
309 repeatCount='indefinite'))
310d.append(c)
311
312# Animate a black circle around an ellipse
313ellipse = draw.Path()
314ellipse.M(-90, 0)
315ellipse.A(90, 40, 360, True, True, 90, 0) # Ellipse path
316ellipse.A(90, 40, 360, True, True, -90, 0)
317ellipse.Z()
318c2 = draw.Circle(0, 0, 10)
319# See for supported attributes:
320# https://developer.mozilla.org/en-US/docs/Web/SVG/Element/animate_motion
321c2.append_anim(draw.AnimateMotion(ellipse, '3s',
322 repeatCount='indefinite'))
323# See for supported attributes:
324# https://developer.mozilla.org/en-US/docs/Web/SVG/Element/animate_transform
325c2.append_anim(draw.AnimateTransform('scale', '3s', '1,2;2,1;1,2;2,1;1,2',
326 repeatCount='indefinite'))
327d.append(c2)
328
329d.save_svg('animated.svg') # Save to file
330d # Display in Jupyter notebook
331```
332
333[](https://github.com/cduck/drawsvg/blob/master/examples/animated.svg)
334
335### Interactive Widget
336```python
337import drawsvg as draw
338from drawsvg.widgets import DrawingWidget
339import hyperbolic.poincare as hyper # python3 -m pip install hyperbolic
340from hyperbolic import euclid
341
342# Create drawing
343d = draw.Drawing(2, 2, origin='center', context=draw.Context(invert_y=True))
344d.set_render_size(500)
345d.append(draw.Circle(0, 0, 1, fill='orange'))
346group = draw.Group()
347d.append(group)
348
349# Update the drawing based on user input
350click_list = []
351def redraw(points):
352 group.children.clear()
353 for x1, y1 in points:
354 for x2, y2 in points:
355 if (x1, y1) == (x2, y2): continue
356 p1 = hyper.Point.from_euclid(x1, y1)
357 p2 = hyper.Point.from_euclid(x2, y2)
358 if p1.distance_to(p2) <= 2:
359 line = hyper.Line.from_points(*p1, *p2, segment=True)
360 group.draw(line, hwidth=0.2, fill='white')
361 for x, y in points:
362 p = hyper.Point.from_euclid(x, y)
363 group.draw(hyper.Circle.from_center_radius(p, 0.1),
364 fill='green')
365redraw(click_list)
366
367# Create interactive widget and register mouse events
368widget = DrawingWidget(d)
369@widget.mousedown
370def mousedown(widget, x, y, info):
371 if (x**2 + y**2) ** 0.5 + 1e-5 < 1:
372 click_list.append((x, y))
373 redraw(click_list)
374 widget.refresh()
375@widget.mousemove
376def mousemove(widget, x, y, info):
377 if (x**2 + y**2) ** 0.5 + 1e-5 < 1:
378 redraw(click_list + [(x, y)])
379 widget.refresh()
380widget
381```
382
383
384
385Note: The above example currently only works in `jupyter notebook`, not `jupyter lab`.
386
387### Frame-by-Frame Animation
388```python
389import drawsvg as draw
390
391# Draw a frame of the animation
392def draw_frame(t):
393 d = draw.Drawing(2, 6.05, origin=(-1, -5))
394 d.set_render_size(h=300)
395 d.append(draw.Rectangle(-2, -6, 4, 8, fill='white'))
396 d.append(draw.Rectangle(-1, 1, 2, 0.05, fill='brown'))
397 t = (t + 1) % 2 - 1
398 y = t**2 * 4 - 4
399 d.append(draw.Circle(0, y, 1, fill='lime'))
400 return d
401
402with draw.frame_animate_jupyter(draw_frame, delay=0.05) as anim:
403# Or:
404#with draw.frame_animate_video('example6.gif', draw_frame, duration=0.05) as anim:
405# Or:
406#with draw.frame_animate_spritesheet('example6.png', draw_frame, row_length=10) as anim:
407 # Add each frame to the animation
408 for i in range(20):
409 anim.draw_frame(i/10)
410 for i in range(20):
411 anim.draw_frame(i/10)
412 for i in range(20):
413 anim.draw_frame(i/10)
414```
415
416GIF:
417
418
419
420Spritesheet (usable in most 2D game engines):
421
422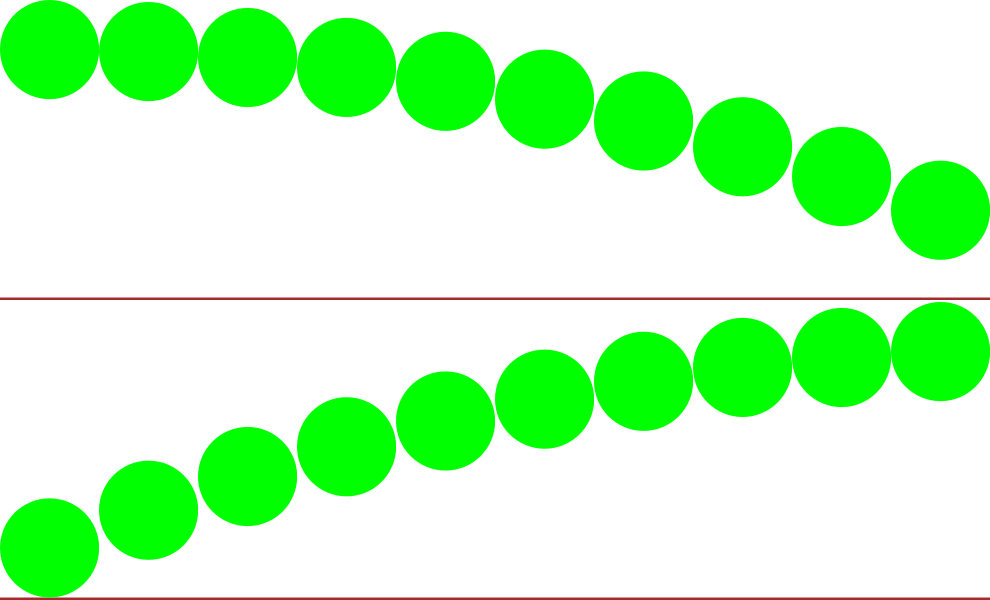
423
424### Asynchronous Frame-based Animation in Jupyter
425```python
426# Jupyter cell 1:
427import drawsvg as draw
428from drawsvg.widgets import AsyncAnimation
429widget = AsyncAnimation(fps=10)
430widget
431# [Animation is displayed here (click to pause)]
432
433# Jupyter cell 2:
434global_variable = 'a'
435@widget.set_draw_frame # Animation above is automatically updated
436def draw_frame(secs=0):
437 # Draw something...
438 d = draw.Drawing(100, 40)
439 d.append(draw.Text(global_variable, 20, 0, 30))
440 d.append(draw.Text('{:0.1f}'.format(secs), 20, 30, 30))
441 return d
442
443# Jupyter cell 3:
444global_variable = 'b' # Animation above now displays 'b'
445```
446
447
448
449Note: The above example currently only works in `jupyter notebook`, not `jupyter lab`.
450
451
452### Embed custom fonts
453```python
454import drawsvg as draw
455
456d = draw.Drawing(400, 100, origin='center')
457d.embed_google_font('Permanent Marker', text=set('Text with custom font'))
458
459d.append(draw.Text('Text with custom font', 35, 0, 0, center=True,
460 font_family='Permanent Marker', font_style='italic'))
461
462d.save_svg('font.svg')
463d # Custom fonts work in most browsers but not in rasterize(), save_png(), or save_video()
464```
465
466[](https://github.com/cduck/drawsvg/blob/master/examples/font.svg)
467
468
469---
470
471# Full-feature install
472Drawsvg may be either be installed with no dependencies (only SVG and SVG-native animation will work):
473```bash
474$ python3 -m pip install "drawsvg~=2.0"
475```
476
477Or drawsvg may be installed with extra dependencies to support PNG, MP4, and GIF output:
478```bash
479$ python3 -m pip install "drawsvg[all]~=2.0"
480```
481
482An additional required package, [Cairo](https://www.cairographics.org/download/), cannot be installed with pip and must be installed separately. When Cairo is installed, drawsvg can output PNG and other image formats in addition to SVG. Install it with your preferred package manager. Examples:
483
484**Ubuntu**
485
486```bash
487$ sudo apt install libcairo2
488```
489
490**macOS**
491
492Using [homebrew](https://brew.sh/) (may require a Python version installed with `brew install python`):
493
494```bash
495$ brew install cairo
496```
497
498**Any platform**
499
500Using [Anaconda](https://docs.conda.io/en/latest/miniconda.html) (may require Python and cairo installed in the same conda environment):
501
502```bash
503$ conda install -c anaconda cairo
504```